By Steve Saltzgiver
Several years ago, while managing a large corporate fleet, the CEO asked why the cost of maintenance and repairs (M&R) on vehicles was increasing exponentially. Fleet costs were increasing by a compounded annual growth rate (CAGR) of 6 percent versus the rate of inflation at the time, which was running about 2 percent per annum.
It does not take a rocket scientist or even a fleet manager, for that matter, to figure out the CAGR of fleet costs exceeding the rate of inflation by almost 3 times presents a major financial concern to the company. This CEO’s question challenged both the Fleet Management and Operations teams to come up with a plausible explanation as to why this severe rise in costs was happening.

Determine Your Direct and Indirect Fleet Costs
To begin this analysis, the fleet professionals’ best friend was the Fleet Management Information System (FMIS). This software solution compiled all direct costs related to managing a fleet of assets. It also tallied indirect costs if fleet management used calculated charge-back rates to pass the total cost of ownership (TCO) back to various departments that used the equipment.
As the fleet team drilled into the FMIS historical fleet data, it found the direct cost increases were related to three driving factors:
- Government regulations and increasing vehicle automation, technology, and complexity
- Increased volume due to the rise of work and vehicle needed
- Mismanaged asset lifecycles


As an example, the Government regulatory cost factor was mainly due to emissions technology from the Federal Government’s Corporate Average Fuel Economy (CAFE) emissions standards that were passed onto consumers during vehicle acquisition and M&R costs. At that time, the purchase price for each truck was 20-30% more than the previous non-emissions models. These emissions costs were self-evident, but not quickly realized in the busy day-to-day life of a fleet team struggling to stay on top of a myriad of priorities. In relative budget dollars over a five-year period, the emissions and automation complexity combined added about $43 million (See figure 2) to the overall asset M&R expenses.
These increased costs reflected negatively on the entire fleet team and virtually no one else in the organization at-large. Both the C-Suite management and the Operations’ team pointed to Fleet Management for its inability to control fleet expenses in an ever-increasingly competitive market.
Importance of Controlling Fleet Expenses
As fleet managers know, the bane of every fleet professional is his or her inability to control expenses related to vehicle management. It places him or her immediately on the hot seat when this unexplained cost phenomenon occurs. Unfortunately, during my career I have witnessed many fleet professionals get relieved of their job duties simply because of their inability to control (or simply explain) increasing fleet costs.
In the case above relating to emissions and automation expenses, these were direct fleet costs caused by indirect fleet cost decisions associated with Government regulations and operational management decisions to optimize emissions and driver productivity.
Knowing these direct and indirect costs can help fleet professionals better understand and explain these cost issues to management and avoid misunderstandings. As an example, even though the indirect costs associated with emissions technology were unavoidable, it was necessary to quantify and explain these increases to management rather than simply ignoring them.

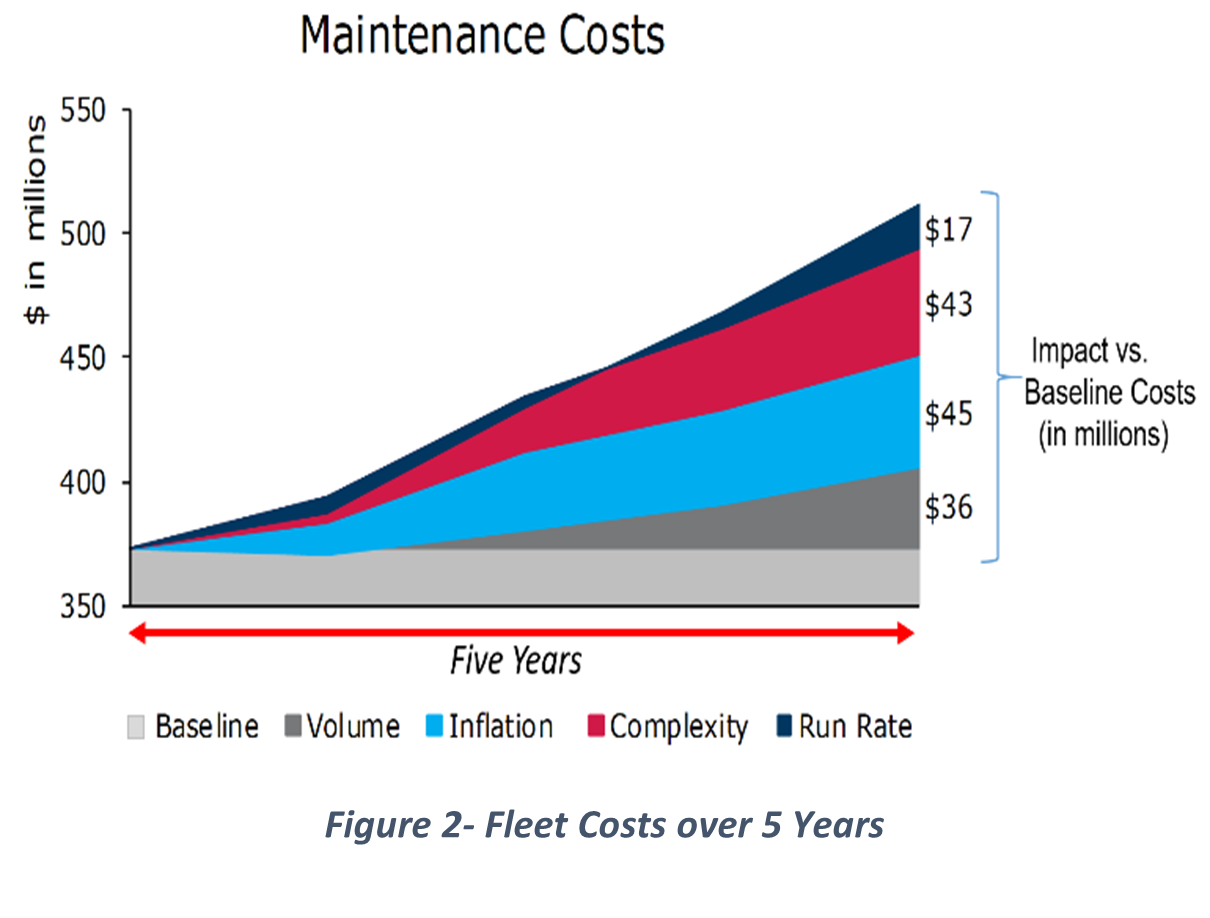
As shown in Figure 2, the actual costs of complexity were less that the rate of inflation over a five-year period. Moreover, the increased cost of $36 million — which related to the increased volume of work from growth — was also a significant factor of the CAGR impact. The factors related to increased growth were attributed to the acquisition of new customers being served and the purchase of new equipment necessary to meet the increased service requirements. Additionally, the costs to affix special automated equipment on assets to permit Operations to increase individual driver efficiency — allowing the department to reduce personnel expenses — also needed to be quantified.
Even though the latter resulted in a direct cost to maintain fleet assets, it was really an indirect cost forced upon fleet management by one of its primary users. The simple answer to these questions was to quantify costs and explain to management who and what was accountable for the cost increase. Moreover, to inform C-Suite management and remind Operations of their direct accountability for these increased expenses. It was determined that over five years, more than $50 million of these expenses was due to vehicle acquisitions, M&R, and the operational budget, reducing personnel through automation.
Further, Fleet Management was able to show the C-Suite and Operations that most added expenses were really related new vehicle acquisitions, increased M&R for these additions and the increase new customer volume. Lastly, Fleet Management found the automation meant to reduce Operations’ drivers was not taking place. Operations managers clung onto drivers because turnover was very high, and they feared being short personnel to complete their mission. So, bottom line, the reduction of Operational budget through automation did not occur as intended and the increases in the fleet expenses were not offset. For the company to realize the reductions from automation, the CFO would need to force Operations to reduce their personnel budget by about $20 million, where automation was nearly half the impact of complexity.
The remainder of increased costs was due to suboptimal lifecycles increasing the run rate, which was really a high-level decision suggested by fleet management that simply was not initiated by the corporate CFO. The CFO’s rationale was based on how optimal lifecycles might impact the company’s cash-flow modeling. Because the CFO was more interested in doing what had always been done the company was not interested in understanding the optimal replacement cycles analysis that was sorely needed to reduce each asset’s total cost of ownership at this juncture.
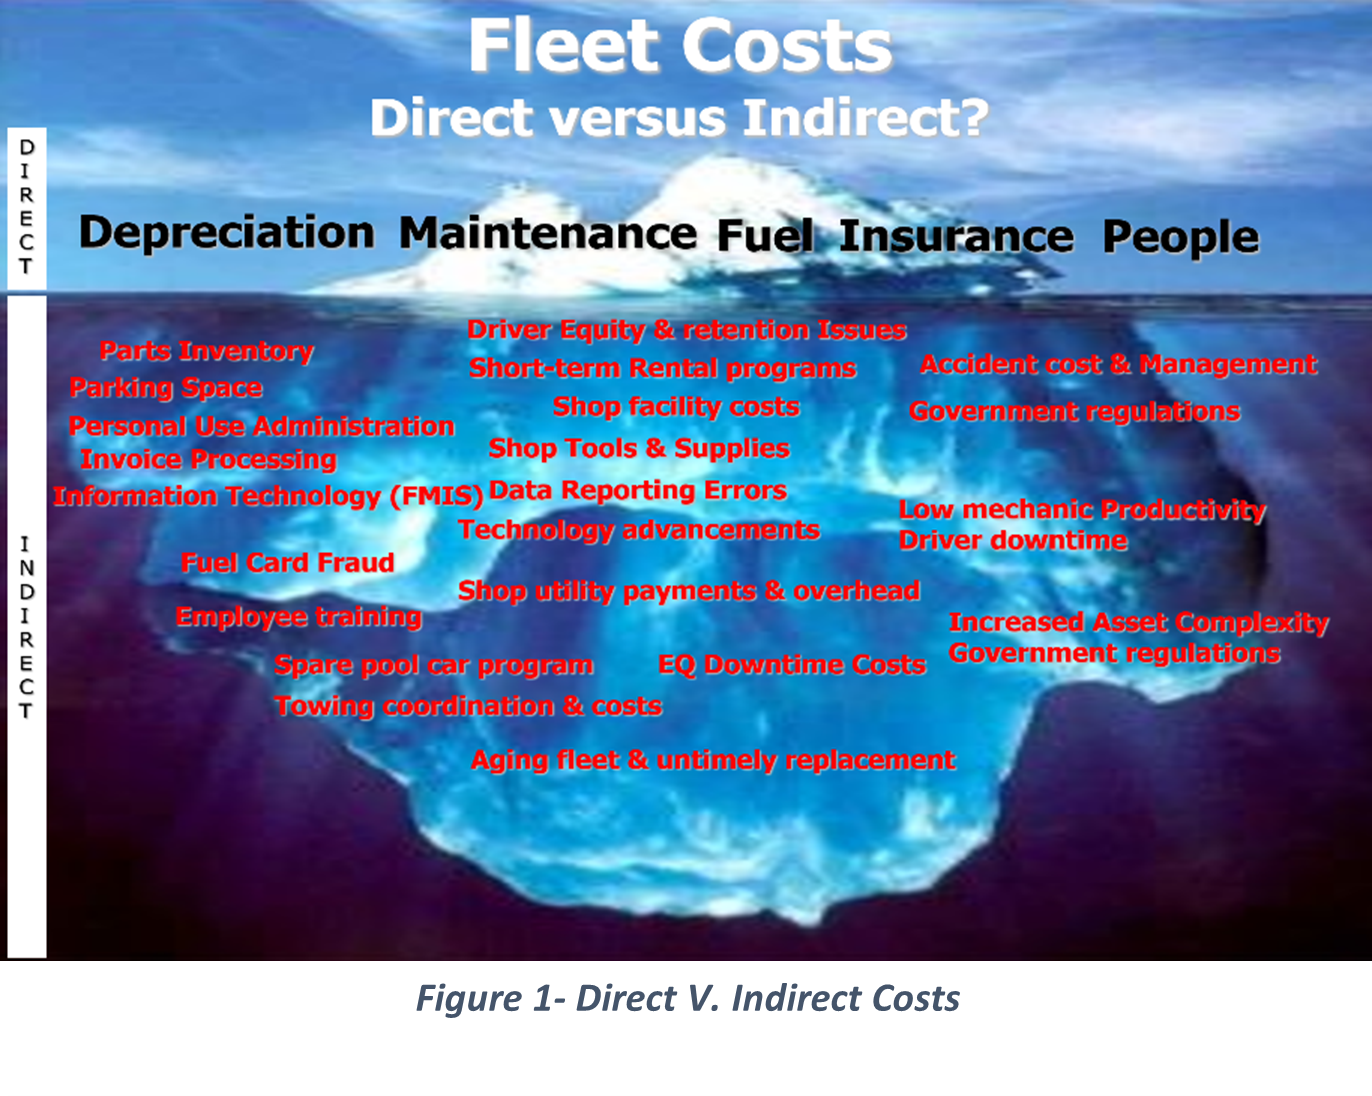
Visual Demonstration of Direct vs. Indirect Costs
In Figure 1, the depiction of an iceberg visually demonstrates examples of direct versus indirect costs. As the picture illustrates, most costs related to fleet management are indirect costs. As is the case shown by the iceberg, the indirect costs of fleet always outnumber the direct costs. Further, the indirect costs are often the soft costs related to managing a fleet of vehicles and are always the hardest to quantify. Figure 2 shows how critical it is for fleet management to understand and explain these expenses to management and its stakeholders. These examples illustrate the overall importance for fleet management professionals to understand that the TCO is critical to the fleet manager’s success and the organization’s bottom line.
Listen: Get Tips on Tracking TCO
In summary, these direct cost increase to fleet were necessary for the company on-the-whole to serve its customers. Nevertheless, to mitigate the increases required Operations had to recognize their indirect cost impact on the fleet budget and act accordingly to reduce their budget. As a best practice, each fleet management professional must work closely with the finance department in their respective organizations to understand the impact of direct and indirect costs, quantify these costs and establish a charge-back process to help all fleet users understand all costs by making them highly visible. This scenario was a rare example where direct and indirect costs were difficult to define and crossed between departments. Nonetheless, in most day-to-day instances in fleet management the direct and indirect costs are contained within the fleet department – and it up to the fleet team to recognize how to identify and quantify these costs along with their impact on the operation. It is essentially impossible to manage an operation effectively and efficiently not knowing the entire costs associated with delivering fleet services to the stakeholders.
Always remember: “Cost visibility equals transparency, and vehicle users can make good financial decisions when costs are readily seen by fleet stakeholders.”
To learn how RTA’s fleet management software solution can help your fleet improve its direct and indirect costs, schedule a demo with our Sales team.